Wednesday 31 August 2022

Gold falls to fresh monthly low below $1,720


Gold came under renewed bearish pressure in the European session Tuesday.

The 10-year US Treasury bond yield is pushing higher, weighing on XAU/USD.

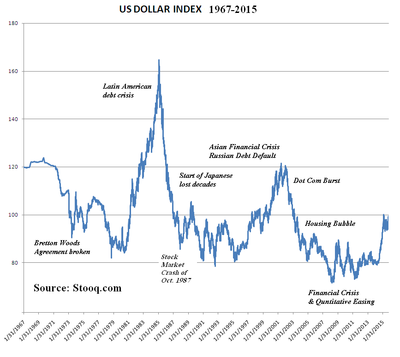
The US Dollar Index gains traction ahead of the employment data.

After having spent the Asian session fluctuating in a relatively tight channel above $1,720, gold turned south during the European trading hours and fell to its lowest level in a month below $1,715.


Rising US yields, dollar strength weigh on gold

The renewed dollar strength amid the souring market mood seems to be weighing on XAU/USD on Wednesday. US stock index futures dropped into negative territory in the European session, suggesting that safe-haven flows are starting to dominate the market action. In turn, the US Dollar Index climbed above 109.00.

Meanwhile, the benchmark 10-year US Treasury bond yield is up nearly 1% on the day at 3.138%, not allowing gold to shake off the bearish pressure.


Moreover, investors grow increasingly worried about gold's demand outlook with China clinging to its zero-Covid policy and imposing renewed restrictions in a number of cities.


In the second half of the day, the ADP will release its private sector employment report for August. Fed policymakers have repeatedly said that they will assess the data before deciding on the size of the September rate hike. The CME Group FedWatch Tool shows that markets are currently pricing in a 71.5% probability of a 75 basis points rate increase at the next FOMC meeting. A stronger-than-expected ADP print could allow hawkish Fed bets to continue to drive the dollar's valuation ahead of Friday's highly-anticipated Nonfarm Payrolls (NFP) report.


Market participants will also pay close attention to the performance of Wall Street's main indexes after the opening bell. Unless there is a noticeable improvement in risk mood, the dollar is likely to preserve its strength during the American session.

WANT DIRECT TALK TO OUR EXPERTS CONTACT MONEY LIFE RESEARCH

Iran Foreign Minister: Carefully reviewing EU-drafted text for revival of 2015 nuclear pact


 Iran's Foreign Minister Hossein Amirabdollahian said on Wednesday that Tehran is carefully reviewing the EU-drafted text for the revival of the 2015 nuclear pact, as reported by Reuters. 

"We need stronger guarantees from the other party to have a sustainable deal,"  Amirabdollahian added. "The (U.N.) agency should close its politically-motivated probes."

Market reaction

Crude oil prices showed no immediate reaction to these comments. As of writing, the barrel of West Texas Intermediate was trading at $89.10, where it was down 3.5% on a daily basis. 

Tuesday 30 August 2022

GBP/USD remains heavy and on track to test the March 2020 low near 1.1410 


GBP/USD traded at a new low for this move on Monday near 1.1650 but has rebounded to trade just above 1.17. Economists at BBH expect the pair to test the March 2020 low near 1.1410.


The notion of a Truss-led UK government is concerning

“Cable remains heavy and on track to test the March 2020 low near 1.1410.”


“We’ve been pointing out for a while that the notion of a Truss-led UK government is concerning. The main planks of her platform are 1) large-scale tax cuts, 2) BoE mandate review, and 3) hard Brexit. None of these can be seen as positive for sterling and gilts and so along with likely recession in Q4, the reasons to be underweight UK assets are piling up.”

WANT TO DIRECT TALK WITH OUR EXPERTS CONTACT MONEY LIFE RESEARCH

Monday 29 August 2022

Gold Price Forecast: XAU/USD looks to $1,700 amid Fed rate hike bets – Confluence Detector


Gold continues losing ground for the second straight day and drops to over a one-month low.

Strong follow-through USD buying, rising US bond yields continue to weigh on the commodity.

The risk-off impulse might turn out to be the only factor that might help limit any further losses.

Gold remains under heavy selling pressure for the second successive day on Monday and drops to over a one-month low, around the $1,720 area during the early part of the European session. The US dollar hits a fresh two-decade high amid rising bets for more aggressive Fed rate hikes and continues to weigh on the dollar-denominated commodity.


In fact, the markets are pricing in a greater chance of a 75 bps rate increase at the September FOMC meeting. A further rise in the US Treasury bond yields reinforces market expectations, which is seen as another factor driving flows away from the non-yielding yellow metal. That said, the prevalent risk-off environment could offer some support to the safe-haven gold and help limit any further losses, at least for the time being.

Gold Price: Key levels to watch

The Technical Confluence Detector shows that the next relevant support for gold is pegged near the $1,719 area - Pivot Point One Day S2. This is closely followed by $1,714-$1,713 zone - Fibonacci 23.6% One Month. A convincing break below will expose the $1,706-$1,705 support - Pivot Point One Week S2 and the $1,700 round-figure mark. Some follow-through selling might make the XAU/USD vulnerable to retesting the YTD low, around the $1,680 region touched in July.


On the flip side, attempted recovery moves might now confront stiff resistance near the $1,728-$1,729 confluence support breakpoint, comprising Previous Week Low and Pivot Point One Day S1. The next relevant hurdle is pegged near the $1,732-$1,733 region - Fibonacci 38.2% One Month. Sustained strength beyond could trigger a short-covering rally towards the $1,737 zone - Fibonacci 23.6% One Week - en route to the $1,741-$1,742 region - Fibonacci 38.2% One Week - and the $1,745 barrier.

About Technical Confluences Detector

The TCD (Technical Confluences Detector) is a tool to locate and point out those price levels where there is a congestion of indicators, moving averages, Fibonacci levels, Pivot Points, etc.  If you are a short-term trader, you will find entry points for counter-trend strategies and hunt a few points at a time. If you are a medium-to-long-term trader, this tool will allow you to know in advance the price levels where a medium-to-long-term trend may stop and rest, where to unwind positions, or where to increase your position size.

WANT TO DIRECT TALK TO OUR EXPERTS CONTACT MONEY LIFE RESEARCH.

US Dollar Index Price Analysis: Immediately to the upside comes 109.77


  • DXY prints fresh cycle highs near 109.50 on Monday.
  • Further upside could revisit the September 2002 high at 109.77.

DXY extends the post-Powell rally to the area of 109.50, recording at the same time new cycle highs.

Further upside remains on the cards for the index in the near term. Against that, the surpass of the 2022 high at 109.47 (August 29) should open the door to the September 2002 top at 109.77 prior to the round level at 110.00.

In the meantime, while above the 6-month support line around 105.40, the index is expected to keep the short-term positive stance.

Looking at the long-term scenario, the bullish view in the dollar remains in place while above the 200-day SMA at 100.74.

Saturday 27 August 2022

USD/CHF Price Analysis: Hovering around the top of the 0.9600-0.9660 range, eyeing 0.9700


  • USD/CHF bounces from weekly lows, set to finish the week with gains of 0.73%.
  • From a daily chart perspective, the USD/CHF has nowhere to go; it would likely remain in consolidation.
  • Near-term, a symmetrical triangle in the USD/CHF 4-hour chart targets 0.9767.

The USD/CHF stages a comeback after hitting weekly lows around 0.9577 earlier in the day and is about to erase Thursday’s losses as the USD/CHF aims towards the 100-DMA, following hawkish remarks by the US Federal Reserve Chief, Jerome Powell. The USD/CHF is trading at 0.9659, up by almost 0.20%.

USD/CHF Price Analysis: Technical outlook

Consolidation in the daily chart will keep the USD/CHF trading within the 0.9600-0.9690 range, as shown by this week’s price action. Worth noting that the support/resistance levels are the 100 and 50-day EMAs, each at 0.9657 and 0.9614, respectively. Therefore, unless the exchange rate decisively breaks above/below the range, the USD/CHF might remain subdued.

Friday 26 August 2022

Gold Price Forecast: XAU/USD to see modest weakness for the remainder of 2022, before recovering in 2023


Gold prices have declined by 3.6% year-to-date. Strategists at ABN Amro have downgraded their gold price outlook, expecting modest weakness for the remainder of 2022, before prices will recover in 2023. 


New year-end forecasts are $1,700 in 2022 and $1,900 in 2023

“We expect modestly lower gold prices for the remainder of this year. There is a crucial support area layered at $1,680-$1,700. We expect these levels to be tested again and prices could move below these, albeit only temporary. Our new forecast for the end of 2022 is $1,700.”

“For 2023, the gold price outlook is more positive. Not only do we expect the US dollar to weaken, but we also expect the Fed to start cutting rates in the second half of 2023. On top of that, we expect lower US real yields. As a result, gold prices are likely to rebound next year. Having said that, we do not believe that gold prices will set a new high though.” 


“Our new year-end 2023 forecast is $1,900.”

WANT DIRECT TALK TO OUR EXPERTS CONTACT MONEY LIFE RESEARCH

GBP/USD needs to clear strong resistance at 1.1870 to gather bullish momentum

GBP/USD has managed to recover above 1.1800 on Friday ahead of FOMC Chairman Jerome Powell’s remarks at the Jackson Hole Symposium. The pair will reveal a buildup of bullish momentum on a break past 1.1870, FXStreet’s Eren Sengezer reports.


Pound struggles to turn bullish ahead of Powell

“In case the chairman's comments suggest that the bank could opt for another 75 basis points in September, GBP/USD could turn south amid a stronger dollar. On the other hand, an optimistic tone inflation outlook should hurt the greenback and help GBP/USD gain traction.”

 On the upside, cable faces key resistance at 1.1870, where the Fibonacci 23.6% retracement level of the latest downtrend is located. Above that level, the 50-period SMA forms interim resistance at 1.1900 ahead of 1.1940 (Fibonacci 38.2% retracement).”

“1.1800 (psychological level, 20-period SMA) aligns as initial support before 1.1750 (static level, end-point of the downtrend) and 1.1720 (Aug. 23 low).”

Thursday 25 August 2022

Crude Oil Edges Higher; China Stimulus Boosts Sentiment


Oil prices edged higher Thursday, on course for strong weekly gains as China attempted to boost demand while global supply remained very tight.


By 08:40 ET (12:40 GMT), U.S. crude futures traded 0.1% higher at $94.94 a barrel, while the Brent contract rose 0.4% to $101.67. Both contracts are on course for weekly gains of around 5%.


U.S. Gasoline RBOB Futures were up 0.2% at $2.8053 a gallon.


The Chinese government announced plans earlier Thursday to top up its economic stimulus to 1 trillion yuan (around $150 billion).


This attempt, to try and restore an economy ravaged by drought and COVID-19 restrictions, has been well-received by the oil market, given China is the largest oil importer in the world.


This news has added positive momentum to a market that had already been boosted by the release of data by the Energy Information Administration showing that U.S. crude inventories fell by much more than expected last week.


The volume of crude and its products exported from the U.S. last week was the highest in a series going back to February 1991.


"EIA numbers released yesterday were fairly constructive," said analysts at ING, in a note. "U.S. commercial crude oil inventories fell by 3.28MMbbls over the last week. However, when taking into account releases from the strategic petroleum reserve, total U.S. crude oil inventories declined by a significant 11.37MMbbls."


Additionally, earlier the week, Saudi Energy Minister Prince Abdulaziz bin Salman flagged the possibility that the Organization of Petroleum Exporting Countries and allies, a group known as OPEC+, could cut production, boosting the market.


He added that futures prices, which have fallen over 25% from their peaks earlier in the summer, are failing to reflect the tightness of the physical market.


Elsewhere, investors are also watching for progress on the revival of a nuclear deal with Iran, which could lead to the resumption of crude exports into the global market from the OPEC producer.


"The U.S. finally replied to the EU’s proposal for reviving the deal," ING added. "And while clearly, negotiations appear to be moving in the right direction, the US has said that "we’re not there yet" and that there are still "gaps" that remain."


WANT TO DIRECT TALK TO OUR EXPERTS CONTACT MONEY LIFE RESEARCH

AUD/USD: Australia/US terms of trade still supporting the aussie – SocGen

 The Australian dollar is Thursday’s top currency. Kit Juckes, Chief Global FX Strategist at Société Générale, expects the aussie to strengthen as Australia’s terms of trade out-performance vs the US persists.


AUD also to outperform European currencies

“We warned at the end of July that August is often a tough month for AUD, and a good month for the dollar. In the event, AUD is only marginally weaker against the dollar than it was at the end of July, and it has done better than the yen (which is unusual for the time of year). However, our desire to get long AUD for the Autumn/|Winter is intact and AUD/USD is still below 0.70.”

“Australia’s terms of trade out-performance vs the US persists. The more the Chinese authorities do to stabilize the economy with fiscal measures, and the less they use a weaker currency to help, the better for the AUD.” 

“We’re long-term bulls, vs the USD, but also against the European currencies.”


Wednesday 24 August 2022

ECB officials are acknowledging the risks of recession


“We believe EUR/USD remains on track to test the September 2002 low near 0.9615.”


“European Central Bank (ECB) executive board member Fabio Panetta stressed that monetary policy ‘needs to be strictly data dependent, taking fully into consideration the condition of the euro-area economy. This implies first of all being fully aware that the probability of a recession is increasing in the euro area because of the consequences of the pandemic, the shock to commodity prices of recent months, because of the war and its consequences for trade and uncertainty’.”


WANT TO DIRECT TALK WITH MY EXPERT CONTACT MONEY LIFE RESEARCH

When are the US durable goods orders and how could they affect EUR/USD?


US durable goods orders overview

Wednesday's US economic docket highlights the release of Durable Goods Orders data for July. The US Census Bureau will publish the monthly report at 12:30 GMT and is expected to show that headline orders rose 0.6% during the reported month, marking a notable slowdown from the 2% increase recorded in June. Orders excluding transportation items, which tend to have a broader impact, are anticipated to grow by a modest 0.2% in July as compared to a 0.4% rise reported in the previous month.

Analysts at Wells Fargo offer a brief preview of the report and explain: “Demand for goods is slowing. That is as true for business spending as it is for personal consumption. For businesses, the growing concern the economy is about to tip into recession is weighing on activity, as well as higher borrowing costs and demand largely having been pulled forward throughout the pandemic.”


How could it affect EUR/USD?

Ahead of the key data, the emergence of fresh US dollar buying drags the EUR/USD pair back closer to its lowest level since December 2002 touched the previous day. A stronger-than-expected domestic data will reinforce hawkish Fed expectations, which, in turn, should result in higher US Treasury bond yields and a stronger USD.

Conversely, a weaker report will further fuel concerns about a global economic downturn and weigh on investors' sentiment, offering some support to the greenback's safe-haven status. This, along with fears of a prolonged energy-supply crunch in the Eurozone, suggests that the path of least resistance for the EUR/USD pair is to the downside.

That said, any immediate market reaction is more likely to be short-lived as market participants might prefer to wait on the sidelines ahead of Fed Chair Jerome Powell's appearance at the Jackson Hole symposium on Friday. Nevertheless, a big divergence from the expected readings might still provide some meaningful impetus to the EUR/USD pair.

Eren Sengezer, Editor at FXStreet, meanwhile, offered a brief technical outlook for the EUR/USD pair: “On the four-hour chart, the Relative Strength Index (RSI) indicator stays well below 40 after having moved out of the oversold territory on Tuesday. Additionally, EUR/USD is yet to make a four-hour close above the descending regression channel coming from August 12. Both of these technical developments suggest that the pair's latest recovery was a technical correction rather than a reversal..”

Eren also outlined important technical levels to trade the EUR/USD pair: “In case the pair starts using 0.9950 (static level, upper limit of the descending regression channel) as support, it could face interim resistance at 0.9975 (20-period SMA) before testing parity. On the downside, 0.9900 (static level, psychological level) aligns as first support before 0.9870 (former resistance area from October 2002) and 0.9800 (psychological level).”

Tuesday 23 August 2022

GBP/USD: Rebound remains capped below 1.1800 amid mixed UK PMIs, bear cross


GBP/USD whipsaws after UK services PMI improves but manufacturing PMI contracts.

The US dollar maintains the pullback amid cautious optimism, weaker Treasury yields.

Bear cross remains in play, as GBP bears eye a daily close below critical 1.1760 support line.

GBP/USD is struggling once again to extend the recovery while holding below the 1.1800 level, as bears remain unconvinced by the mixed UK Preliminary Business PMI surveys.


While activity in the services sector remained near July's 52.6, the manufacturing component tumbled to 46.0 in August from 52.1 in July, its lowest since May 2020.


Although a minor improvement in risk sentiment after an upside surprise delivered by the German Preliminary PMI eases fears over an imminent recession and lifts the European stocks. This helps the higher-yielding GBP to hold its ground against the US dollar.


The greenback pulls back from close to 19-year highs amid the retreat of the US Treasury yields across the curve. Investors also book profit on their USD longs after the recent relentless rise and ahead of a fresh batch of relevant US economic data. The US S&P Global Preliminary manufacturing and services PMIs will be reported in the NA session, followed by the New Home Sales release.

Despite the renewed upside, cable remains vulnerable, as the state of the UK economy remains dire amid surging inflation, the European gas crisis and political concerns.


As observed on cable’s daily chart, the price is clinging to the critical support line at 1.1760. A daily closing below the latter is required to cement the ongoing downtrend towards the falling trendline support at 1.1565.


Ahead of that, 1.1600 – the round figure will challenge the bullish commitments. The 14-day Relative Strength Index (RSI) has stalled its descent but sits just above the oversold territory, suggesting that the downside remains more compelling.


Further, the 21-Daily Moving Average (DMA) has cut the 50 DMA from above, representing a bear cross and adding credence to the bearish potential.

WANT DIRECT TALK TO OUR MARKET EXPERT CONTACT MONEY LIFE RESEARCH

US Dollar Index Price Analysis: The surpass of the YTD high exposes 109.77


  • DXY remains bid and flirts with the 2022 top near 109.30.
  • Further north of comes the September 2002 high around 109.80.

DXY keeps the rally well and sound and trades at shouting distance from the YTD highs near 109.30 on Tuesday.

The continuation of the upside momentum looks increasingly likely in the very near term. That said, beyond the 2022 high at 109.29 (July 14) the index could challenge the September 2002 peak at 109.77 prior to the round level at 110.00.

In the meantime, while above the 6-month support line near 105.10, the index is expected to keep the short-term positive stance.

Looking at the long-term scenario, the bullish view in the dollar remains in place while above the 200-day SMA at 100.49.

Monday 22 August 2022

Gold Price Forecast: XAU/USD bears target $1,720 as US dollar keeps reins


Gold price extends its losing streak into the sixth straight day on Monday.

US dollar resumes its rally as risk-aversion gathers steam amid surging energy costs.

XAU/USD needs to crack $1,730 to extend the sell-off towards $1,720 and $1,714.  

Gold price remains under intense selling pressure at the start of the week, extending the previous week’s bearish momentum into the sixth straight day. The relentless demand for the safe-haven US dollar could be linked as the main underlying factor behind the latest sell-off in the bright metal. Investors witness flight to safety amid hawkish Fed expectations and surging energy costs in Europe and Asia after Russia’s Nord Stream 1 pipeline announced its closure due to maintenance end of this month. Global central banks’ fight to tame inflation is likely to prolong amid rising food and energy prices, which dents risk appetite while weighing negatively on the non-interest bearing yellow metal. Gold traders shrug off the minor pullback in the US Treasury yields, as the dollar will likely remain the preferred safety bet heading into the much-awaited Kansas City Fed’s Jackson Hole Symposium, scheduled later this week.


Gold Price: Key levels to watch

The Technical Confluence Detector shows that the gold price is eyeing a fresh downswing towards the Bollinger Band one-day Lower at $1,720 should bears yield a sustained break below the $1,730 barrier. That level is the intersection of the pivot point one-day S3 and pivot point one-week S1.

The next critical support area is located around $1,714, the Fibonacci 232.6% one-month.


Alternatively, the metal could rebound towards the pivot point one-day S2 at $1,737 should bears face exhaustion.


Further up, the pivot point one-day S1 at $1,743 will come into the picture. Bulls will then look to recapture the previous day’s low of $1,746.


The last line of defense for XAU sellers is envisioned at the confluence of the SMA200 four-hour and the Fibonacci 23.6% one-day around $1,750.


WANT TO DIRECT TALK TO OUR MARKET EXPERT CONTACT MONEY LIFE RESEARCH

EUR/JPY Price Analysis: Interim top remains at 138.40


  • EUR/JPY seems to have now moved into a consolidative phase.
  • Immediately to the upside emerges the August high at 138.40.

EUR/JPY fades Friday’s advance and resumes the downside around the 137.00 region on Monday.

If the cross manages to break above the ongoing range bound theme, the so far August high at 138.39 (August 10) is expected to come into focus once again. Above the latter, EUR/JPY could attempt a move to the 55-day SMA, today at 139.36.

While above the 200-day SMA at 134.08, the prospects for the pair should remain constructive.

Friday 19 August 2022

Oil: Renewal of the nuclear agreement argues against a noticeable recovery – Commerzbank

 Brent Oil has dropped to a six-month low this week. Any recovery in oil prices is unlikely, in the opinion of economists at Commerzbank.


Oil prices should see their downward trend flatten out

“For one thing, fears of recession in the industrialised countries have been joined by serious concerns about China’s economy. And for another, a renewal of the nuclear agreement with Iran, which would involve sanctions being lifted, has probably never been within such tangible reach before.”

“Though oil prices should see their downward trend flatten out, a noticeable price recovery would probably only be triggered if the US were to reject a renewal of the nuclear agreement.”

Thursday 18 August 2022

USD/TRY leaps to fresh 2022 peaks past 18.00 after CBRT cut rates


  • USD/TRY clinches new YTD tops beyond the 18.00 mark.
  • The pair now targets the all-time top at 18.25 (December 20 2021).
  • The Turkish central bank reduced the policy rate by 100 bps.


The Turkish lira debilitates to fresh lows vs. the greenback and pushes USD/TRY past the 18.00 yardstick for the first time since December 2021.

USD/TRY now targets the all-time high at 18.25

USD/TRY leaves behind the key barrier at 18.00 after the Turkish central bank (CBRT) caught the markets off guard and reduced the One-Week Repo Rate by a full point to 13.00% at its meeting earlier on Thursday. the central bank also cut the Overnight Borrowing Rate and the Overnight Lending Rate by 100 bps to 11.50% and 14.50%, respectively.

In its statement, the CBRT continues to see domestic inflation largely driven by higher energy costs exclusively on the back of geopolitical events and “effects of pricing formations that are not supported by economic fundamentals”.

Wednesday 17 August 2022

S&P 500 Index: Potential peak at 4327/70 – Credit Suisse

 The S&P 500 Index now face a key test of technical resistance at the 200-day moving average (DMA), potential downtrend and 61.8% retracement at 4327/70, with Credit Suisse’s bias for a potentially important top here.


Weekly MACD momentum maintains its bullish cross

“Although weekly MACD momentum has crossed higher, we continue to look for a potentially important top at the falling 200-DMA, potential downtrend from the beginning of the year and 61.8% retracement of the 2022 fall at 4327/70.”

“Near-term support is seen at 4177, with a break below 4117/07 seen as needed to add weight to our view for a fall back to the 63-day average, now at 3974.”

“A close above 4370 would suggest strength can extend further, with resistance seen next at 4513, then the 78.6% retracement of the 2022 fall at 4566.”

Tuesday 16 August 2022

EUR/USD: Break below 1.01 open up the July 14 cycle low near 0.9950 – BBH


EUR/USD declines toward 1.0100. A drop under this level would set up a test of the July 14 cycle low near 0.9950, economists at BBH report.


German August ZEW consumer survey was weak

“A break below 1.0110 would set up a test of the July 14 cycle low near 0.9950.”


“Expectations came in at -55.3 vs. -52.7 expected and -53.8 in July, while current situation came in at -47.6 vs. -49.0 expected and -45.8 in July. ZEW noted that ‘The still high inflation rates and the expected additional costs for heating and energy lead to a decrease in profit expectations for the private consumption sector’.”


WANT TO DIRECT TALK OUR EXPERT CONTACT MONEY LIFE RESEARCH

Friday 12 August 2022

Gold Price Forecast: XAU/USD to struggle on a peak in US inflation – ANZ


The challenges for the gold market are still in place. A peak in US inflation suggests a downside risk to the gold price. Still, increasing recessionary pressure and geopolitical risks could protect the downside, economists at ANZ Bank report.


Geopolitical and economic growth risks could protect the downside

“In 1980 when inflation peaked at 14.7%, gold prices started retreating from a high of $631/oz. Something similar happened in 2011, when inflation hit a high of 3.9% in September, triggering a fall from $1,900. With inflation peaking at 9% in June, we could see a similar fall in XAU/USD. The winding down of the Fed’s balance sheet also does not bode well.”

“Rising geopolitical tensions and economic risks could lend some support. The Russia-Ukraine war and China-US relations are issues that could trigger haven buying.”

WANT TO DIRECT TALK OUR EXPERT CONTACT MONEY LIFE RESEARCH

Wednesday 10 August 2022

EUR/USD finally breaks above 1.0300 to print 5-week highs

EUR/USD surpasses the key 1.0300 level post-US CPI.

Germany Final CPI rose 7.5% YoY in July.

US CPI surprised to the downside at 8.5% in July.

EUR/USD sees its upside gathers further traction and advance to new multi-week peaks past the 1.0300 level on Wednesday.


EUR/USD boosted by USD-weakness

EUR/USD quickly left behind the key hurdle at 1.0300 the figure after US inflation figures tracked by the CPI disappointed expectations. Indeed, consumer prices rose 8.5% in the year to July, while the CPI excluding food and energy costs rose 5.9% from a year earlier, coming in also below initial estimates for a 6.1% YoY gain.

The pair’s sharp upside follows the equally abrupt – although in the opposite direction – decline in the greenback, as investors now perceive that the Federal Reserve might save a 75 bps rate hike for later and raise rates by half point instead at the September gathering.

On the latter, the probability of a 75 bps hike by the Fed in September shrank to around 27% from nearly 70% before the CPI data was published, according to CME Group’s FedWatch Tool.


What to look for around EUR

EUR/USD breaks above the 1.0300 hurdle with certain conviction helped by the intense drop in the dollar in the wake of lower-than-expected US CPI prints for the month of July.


Price action around the European currency, in the meantime, is expected to closely follow dollar dynamics, geopolitical concerns, fragmentation worries and the Fed-ECB divergence.


On the negatives for the single currency emerges the so far increasing speculation of a potential recession in the region, which looks propped up by dwindling sentiment gauges and the incipient slowdown in some fundamentals.


Key events in the euro area this week: Germany Final Inflation Rate (Wednesday) – EMU Industrial Production (Friday).


Eminent issues on the back boiler: Continuation of the ECB hiking cycle. Italian elections in late September. Fragmentation risks amidst the ECB’s normalization of monetary conditions. Impact of the war in Ukraine on the region’s growth prospects and inflation.


EUR/USD levels to watch

So far, spot is gaining 1.23% at 1.0340 and faces the next up barrier at 1.0346 (monthly high August 10) seconded by 1.0377 (55-day SMA) and finally 1.0615 (weekly high June 27). On the flip side, a break below 1.0096 (weekly low July 26) would target 1.0000 (psychological level) en route to 0.9952 (2022 low July 14).

WANT TO DIRECT TALK OUR EXPERT CONTACT MONEY LIFE RESEARCH

Nervous calm as dollar prepares for inflation test


Major currencies held steady on Wednesday, with traders cautious about placing large bets ahead of U.S. inflation data, which markets will scrutinise for guidance on how steeply the U.S. Federal Reserve will raise interest rates in coming months.

The figures are due at 1230 GMT. Economists expect year-on-year headline inflation to be running at a scorching 8.7%, a small retreat from June's whopping 9.1% figure. Core inflation is expected at 0.5% month-on-month.

The greenback was broadly steady, having paused a bit from a retreat that began in the middle of July.

It bought 135 Japanese yen and sat at $1.0215 per euro and $1.2089 versus sterling, all little changed on the day and largely unchanged since the start of this week.

"All eyes are on U.S. CPI," said Carol Kong, a currency strategist at Commonwealth Bank of Australia (OTC:CMWAY).

"Currencies have been quiet this week, and barring a major news event we don't expect the dollar to move out its range before the data."

Traders expect reaction to turn on the core inflation figure.

"The market will initially get more excited by a downside core CPI surprise than an upside surprise," said Deutsche Bank (ETR:DBKGn) strategist Alan Ruskin. A downward surprise would feed into hopes that falling commodity prices mean inflation can quickly recede.

"It will also play to the market's recent proclivity to buy risk dips, and will be a broad-based negative for the U.S. dollar,

Tuesday 9 August 2022

Russia suspends oil exports via southern leg of Druzhba pipeline – Reuters


Citing two sources familiar with the operation, Reuters reported on Tuesday that Russia suspended oil exports via the southern leg of the Druzhba pipeline from early August due to issues relating to transit fees.


"According to the sources, the payment from Russia's pipeline monopoly Transneft to Ukraine's pipeline operator Ukrtransnafta did not go through," Reuters explained.


Market reaction

Crude oil prices rose sharply with the initial reaction to this development. As of writing, the barrel of West Texas Intermediate was trading at $91.85, where it was up 1.55% on a daily basis.

WANT TO DIRECT TALK OUR EXPERT CONTACT MONEY LIFE RESEARCH

Dollar stuck ahead of key U.S. inflation print


 LONDON (Reuters) - The dollar lurked below recent highs on Tuesday as traders awaited this week's key U.S. inflation print for any signs that price pressures are finally abating and that the need for further aggressive U.S. interest rate hikes is easing.

Unexpectedly strong U.S. jobs data on Friday had boosted the greenback, which posted its biggest daily percentage gain since mid-June against the yen that day as investors ramped up bets on a 75 basis point (bps) rate rise in September.

But the currency has pulled back since then as focus shifted to Wednesday's July consumer price index (CPI).

The dollar index, which measures the currency's value against a basket of other peers, was marginally lower at 106.23. It held below a more than one-week peak hit on Friday at 106.93.

Sterling was little changed at around $1.2055 and the euro was 0.2% firmer at $1.0213. The dollar was also flat around 134.90 yen.

"I'm a bit concerned about inflation tomorrow. The market has been wrong-footed all year and if we get a strong core inflation print that will nail expectations for a 75 bps rate hike in September," said Kenneth Broux, a currency strategist at Societe Generale (OTC:SCGLY) in London.

"It's too soon to say it's time to short the dollar as the Fed may have to do more."

The U.S. Federal Reserve hiked rates by a hefty 75 bps in June and July. Money-market futures show traders see about a two-thirds chance of a 75 bps hike next month and have started pushing expectations for rate cuts deeper into 2023.

Economists polled by Reuters see year-on-year headline inflation at 8.7% - incredibly high, but below last month's 9.1% figure. The Fed targets inflation at 2%.

Last week's strong labour data stoked expectations of aggressive near-term hikes, pushing short-dated Treasury yields further above long-term peers.

The gap between two and 10-year Treasury yields, a reliable recession indicator, has grown to its largest in two decades. [US/]

On Monday, a New York Fed survey showed consumers' inflation expectations fell sharply in July, perhaps offering a sliver of hope that the CPI release brings relief.

"The market understandably is waiting for the numbers to then reprice, rather than moving in anticipation of them," said Ray Attrill, head of foreign exchange strategy at National Australia Bank (OTC:NABZY) in Sydney.

The dollar's haven status, though, makes the greenback's reaction a little harder to predict, especially as growth and geopolitical worries swirl.

Consumer confidence slid in Australia for a ninth straight month and the Australian and New Zealand dollars edged lower as London trade got under way.

China extended military drills near Taiwan, and the self-ruled island's foreign minister said China was using the drills launched in protest against U.S. House Speaker Nancy Pelosi's visit as an excuse to prepare for an invasion.

Monday 8 August 2022

Gold Price Forecast: XAU/USD needs to crack $1,763 to extend the downside


Gold price nurses losses after impressive US NFP-inspired sell-off.

US dollar eases in tandem with the Treasury yields amid a better mood.

XAU/USD looks south towards $1,750, as 75 bps Sept Fed rate hike bets rise.

Gold price is licking its wound below the $1,800 mark, awaiting a fresh catalyst for the next leg lower. Risk-on flows have returned at the start of the week, fuelling a broad-based US dollar retreat while the Treasury yields also ease. Investors assess the implications of a super-sized Fed rate next months, the odds for which now stand at 70% after a big upside surprise in the US Nonfarm Payrolls for July. The jobs blowout raised the stakes for the July US inflation report due on Wednesday. The US Consumer Price Index (CPI) could likely see a slight pullback in headline growth but the core figure is seen accelerating. The debate of peak inflation remains in play heading into the key event risk of the week. The non-yielding bullion is expected to remain highly reactive to the US employment and inflation data after the Fed said that it remains data-dependent while deciding on its policy outlook.

Gold Price: Key levels to watch

The Technical Confluence Detector shows that the gold price needs to slice through a bunch of healthy support levels around the $1,772-$1,771 area to resume the post-NFP sell-off.


That demand zone is the convergence of the SMA5 one-day, Fibonacci 23.6% one-day and the previous low four-hour.


The Fibonacci 61.8% one-week at $1,769 will be next on sellers’ radars. However, bears need acceptance below the confluence of the Fibonacci 61.8% one-month and pivot point one-day S1 at $1,763 to negate the recent bullish momentum.

Further south, the intersection of the previous week’s low and the pivot point one-week S1 at $1,754 will guard the downside.


On the upside, the immediate resistance appears at $1,775, above which the Fibonacci 38.2% one-week at %1,780 will be challenged.


The next resistance levels are located at $1,784 and $1,786, which are the Fibonacci 61.8% one-day and Fibonacci 23.6% one-week respectively.

About Technical Confluences Detector

The TCD (Technical Confluences Detector) is a tool to locate and point out those price levels where there is a congestion of indicators, moving averages, Fibonacci levels, Pivot Points, etc.  If you are a short-term trader, you will find entry points for counter-trend strategies and hunt a few points at a time. If you are a medium-to-long-term trader, this tool will allow you to know in advance the price levels where a medium-to-long-term trend may stop and rest, where to unwind positions, or where to increase your position size.

WANT TO DIRECT TALK OUR EXPERT CONTACT MONEY LIFE RESEARCH

Remarketing tags may not be associated with personally identifiable information or placed on pages related to sensitive categories. See more information and instructions on how to setup the tag on: http://google.com/ads/remarketingsetup --------------------------------------------------->