Showing posts with label forex signal provider malaysia. Show all posts

Tuesday, 18 October 2022

USD Index Price Analysis: No changes to the consolidative theme


  • DXY attempts a mild rebound after bottoming out near 111.80.
  • Further range bound remains on the cards for the time being.

DXY bounces off multi-session lows in the 111.80/75 band on Tuesday.

So far, the index looks poised to keep navigating within a 112.00-114.00 range at least until the next FOMC event.

The prospects for extra gains in the dollar should remain unchanged as long as the index trades above the 8-month support line near 108.00.

In the longer run, DXY is expected to maintain its constructive stance while above the 200-day SMA at 103.43.


Friday, 30 September 2022

EUR/JPY Price Analysis: Still scope for a move to 144.00


  • EUR/JPY comes under some pressure and fades two daily gains in a row.
  • There is still room for a potential rebound to the 144.00 region.

EUR/JPY seems to have met decent resistance around daily highs near 142.30 at the end of the week.

The continuation of the bounce off last week’s lows remains on the table in the very near term. That said, the cross could therefore extend the bullish attempt to the weekly top at 144.04 (September 20), which is deemed as the last defense for a move to the 2022 peak at 145.63 (September 12).

In the meantime, while above the key 200-day SMA at 135.84, the constructive outlook for the cross should remain unchanged.

Wednesday, 21 September 2022

Malaysia: Trade balance figures came on the strong side – UOB

 UOB Group’s Senior Economist Julia Goh and Economist Loke Siew Ting review the latest trade balance figures in Malaysia.


Key Quotes

“Malaysia’s external trade surprisingly posted stronger gains last month, in part due to year-ago low base effects. Export growth hit a 16-month high of 48.2% y/y in Aug (Jul: +38.0%, UOB est: +30.5%, Bloomberg est: +34.3%) as a result of a triple-digit gain in re-exports (+112.5%) versus a double digit gain in domestic exports (+34.8%). Imports posted the largest ever annual growth on record, at 67.6% (Jul: +41.8%, UOB est: +48.0%, Bloomberg est: +48.0%). This brought trade surplus higher to MYR16.9bn from MYR15.6bn in the preceding month.”

“Increased shipments of commodity-based and electrical & electronic (E&E) products amid stronger demand from almost all trading partners were key drivers of robust export growth in Aug. Exports of petroleum products, liquefied natural gas (LNG) and optical & scientific equipment registered the highest monthly value in the month. Exports to the ASEAN region, South Korea and Hong Kong improved by more than 50% while shipments to the US jumped the most in 15 months by 38.2%.”

“Given that Aug’s export reading defied our earlier expectations of a soft patch in the greater part of 2H22 and the 30.3% year-to-date export growth moved further apart from our full-year growth target of 18.0%, we now upgrade our export growth projection to 26.0% for 2022 with statistical base and commodity price effects remaining wildcards for the outlook. We expect the recent retreat in major commodity prices and lingering global uncertainties particularly a global recession risk to weigh on Malaysia’s export outlook going into 2023, leading to a modest export growth of 1.5% next year.”


Friday, 16 September 2022

USD/CNH: Next on the upside comes 7.0500 – UOB

 Quek Ser Leang at UOB Group’s Global Economics & Markets Research suggests USD/CNH could retest 7.1000 once 7.0500 is cleared.


Key Quotes

“In our last Chart of the Day update from 29 Aug 2022, when USD/CNH was trading at a much lower level of 6.9200, we titled our update ‘USD/CNH could continue to advance, likely at a rapid pace as there are hardly any resistance levels of note until 7.0000’. While our view of a ‘rapid pace of advance’ was not wrong, USD/CNH did not break 7.0000 as it soared to 6.9967 about a week later before pulling back to a low of 6.9100.”

“USD/CNH rebounded sharply from 6.9100 and yesterday (15 Sep 2022), it cracked 7.0000. The break of the ‘psychological level’ resulted in a swift and sharp surge and USD/CNH continues to accelerate higher today. The price actions are not surprising as the next resistance level of note is at 7.0500. Looking ahead, if 7.0500 is broken, the focus will shift to 7.1000. Within these couple of months, the 2019 and 2020 highs, both near 7.1960, are unlikely to come into view.”

On the downside, the rising trend-line support, currently at 6.9400, is a strong support level but only a breach of the 21-day exponential moving average (at the time of writing, the level is at 6.9260) would indicate the current strong upward pressure has eased.”

Friday, 9 September 2022

Malaysia: BNM hikes rates again – UOB


Senior Economist Julia Goh and Economist Loke Siew Ting at UOB Group review the latest interest rate decision by the BNM.


Key Takeaways

“As widely expected, Bank Negara Malaysia (BNM) raised the Overnight Policy Rate (OPR) today (8 Sep) by 25bps to 2.50%. This marks the third back-to-back rate hike since BNM started the hiking cycle in May this year as the economy recovered at a stronger pace. To date, BNM has hiked 75bps, which partly reversed the 125bps of rate cuts since the start of the pandemic in Jan 2020.”

“In the latest monetary policy statement (MPS), BNM continues to expect the domestic economy to expand, supported by private sector spending amid the transition to endemicity, positive labour market conditions, resumption of tourism activities and investments. However, BNM cautioned that external demand is expected to moderate amid softer global growth. BNM expects inflation to peak in 3Q22 before moderating thereafter amid abating base effects and easing global commodity prices.”

“BNM highlighted that there is no ‘pre-set course’ and the monetary policy committee (MPC) will continue to assess developments and their impact on domestic inflation and growth. BNM also reiterated that any adjustments will be done in a ‘measured and gradual’ manner. We think BNM may have signalled a temporary pause for rate hikes pending forward-looking growth and inflation dynamics. As such, we maintain our OPR target at 2.50% by year-end, and 3.00% by mid-2023. The next and final monetary policy meeting for the year is on 2-3 Nov.”

Wednesday, 10 August 2022

Nervous calm as dollar prepares for inflation test


Major currencies held steady on Wednesday, with traders cautious about placing large bets ahead of U.S. inflation data, which markets will scrutinise for guidance on how steeply the U.S. Federal Reserve will raise interest rates in coming months.

The figures are due at 1230 GMT. Economists expect year-on-year headline inflation to be running at a scorching 8.7%, a small retreat from June's whopping 9.1% figure. Core inflation is expected at 0.5% month-on-month.

The greenback was broadly steady, having paused a bit from a retreat that began in the middle of July.

It bought 135 Japanese yen and sat at $1.0215 per euro and $1.2089 versus sterling, all little changed on the day and largely unchanged since the start of this week.

"All eyes are on U.S. CPI," said Carol Kong, a currency strategist at Commonwealth Bank of Australia (OTC:CMWAY).

"Currencies have been quiet this week, and barring a major news event we don't expect the dollar to move out its range before the data."

Traders expect reaction to turn on the core inflation figure.

"The market will initially get more excited by a downside core CPI surprise than an upside surprise," said Deutsche Bank (ETR:DBKGn) strategist Alan Ruskin. A downward surprise would feed into hopes that falling commodity prices mean inflation can quickly recede.

"It will also play to the market's recent proclivity to buy risk dips, and will be a broad-based negative for the U.S. dollar,

Wednesday, 3 August 2022

US Dollar Index Price Analysis: Another visit to 105.00 remains on the cards


  • DXY reverses the earlier bull run to the 106.50/55 band.
  • The resumption of the selling bias could extend to 105.00.

DXY leaves behind Tuesday’s strong advance and sparked a corrective downside soon after hitting new 3-day peaks in the mid-106.00s on Tuesday.

Tuesday’s bounce did not clear any up barrier of note and thus leaves the index vulnerable to further weakness in the very near term at least. On this, the dollar faces the tangible chance to slip back to the multi-week lows in the 105.00 region (August 2) in the short term. This initial area of contention remains propped up by the proximity of the 55-day SMA, today at 104.84.

Furthermore, the broader bullish view in the dollar remains in place while above the 200-day SMA at 99.62.

Saturday, 30 July 2022

EUR/USD Price Analysis: Range bound within 1.0100-1.0260 since July 22


  • The EUR/USD is set to finish the week almost flat, gaining 0.05%.
  • The shared currency daily chart is neutral-to-downwards, but the hourly is neutral-to-upwards.
  • EUR/USD Price Analysis: A daily close above 1.0200 could pave the way towards 1.0300; otherwise, it might drop towards 1.0096.

The EUR/USD is trading at 1.0220, after hitting a daily high at 1.0254, but later tumbled towards the daily low at 1.0145 on elevated US inflation data. In June, the Personal Consumption Expenditures (PCE) rose by 6.8% YoY, fueling expectations of additional Federal Reserve rate hikes, despite the market's pricing in only 80 bps of tightening.

EUR/USD Price Analysis: Technical outlook

From a daily chart perspective, the EUR/USD remains neutral-to-downward biased, helped by the 20-day EMA lying below the exchange rate at 1.0167. Nevertheless, the EUR/USD, unable to capitalize on an upbeat market mood, and broad US dollar weakness, keeps the shared currency exposed to further selling pressure. If EUR/USD buyers want to shift the bias to neutral, they must reclaim the May 13 low-turned-resistance at 1.0348. Once cleared, a challenge of the 50-day EMA at 1.0423 is on the cards. On the other hand, if EUR/USD sellers achieve a daily close below 1.0200, that would pave the road towards 1.0096.

Wednesday, 30 March 2022

EUR/USD pares back from multi-week highs in 1.1160s, still well supported after hot EZ inflation readings


  • EUR/USD has pulled back from earlier multi-week highs in the 1.1160s but remains well supported in the 1.1140 area.
  • USD continues to suffer from broad weakness versus the majority of its G10 counterparts despite less optimistic Russo-Ukraine updates.
  • Meanwhile, hot Eurozone inflation data has encouraged euro buying as US data comes into focus.

Though the pair has waned from its earlier multi-week highs in the 1.1160s after selling pressure ahead of the 50-Day Moving Average near 1.1180 emerged, EUR/USD continues to trade with healthy on-the-day gains of about 0.4% in the 1.1130s. The US dollar continues to suffer from broad weakness versus the majority of its G10 counterparts, even as recent tailwinds in the global equity space subside amid less optimistic headlines regarding Russo-Ukraine peace talks, lifting EUR/USD. Another factor likely encouraging euro buying against the buck is recent hot inflation readings coming out of the Eurozone which, as ECB President Christine Lagarde this morning remarked, support the ECB’s recent shift towards ending QE in Q3 and signaling rate hikes in Q4.

Ahead of the release of preliminary national German Consumer Price Inflation metrics for March at 1300BST, regional state CPI data releases earlier in the session saw sizeable MoM and YoY gains. Meanwhile, the preliminary estimate of Spanish headline HICP inflation in March hit a staggering 9.8%, well above the 8.1% expected. Upcoming German inflation figures are expected to be hot and thus may not provoke a market reaction, and EUR/USD focus will quickly shift to US data scheduled for release shortly after. US private payroll company ADP releases its estimate of US employment change in March at 1315BST and, though ADP’s metric has been a poor predictor of the official NFP in recent months, traders will nonetheless take note.


Shortly after at 1330BST, the final estimate of US GDP growth in Q4 2021 will be released and there will be remarks from Fed’s Thomas Barkin, Raphael Bostic and Esther George, all of whom support the Fed’s recent hawkish shift. Fed hawkishness/strong economic data is arguably well priced into USD at this point, and further profit-taking on US dollar longs coupled with inflationary Eurozone data may well mean EUR/USD remains supported above 1.1100 and eyes a move towards 1.1200.

Tuesday, 29 March 2022

Singapore: Industrial Production remains robust – UOB

 Economist at UOB Group Barnabas Gan reviews the latest industrial production figures in Singapore.


Key Takeaways

“Industrial production surged 17.6% y/y (+16.6% m/m sa) in Feb 2022, surprising market expectations for a 6.3% y/y (+5.7% m/m sa) growth. Excluding biomedical manufacturing, industrial production rose 16.8% y/y.”

“The strong performance in Singapore’s manufacturing sector is underpinned by the global trade recovery, especially on the back of healthy semiconductor- and biomedical-related demand. Other factors that have supported Singapore’s manufacturing momentum also include the gradual reopening of international borders, which resulted in higher levels of maintenance, repair and overhaul activity from commercial airlines.”

“In all, our outlook is for full-year manufacturing to grow by an average of 4.0% in 2022. This suggests that despite the high-base growth rate seen in 2021, global trade activity is expected to stay buoyant in the new year.”

Friday, 28 January 2022


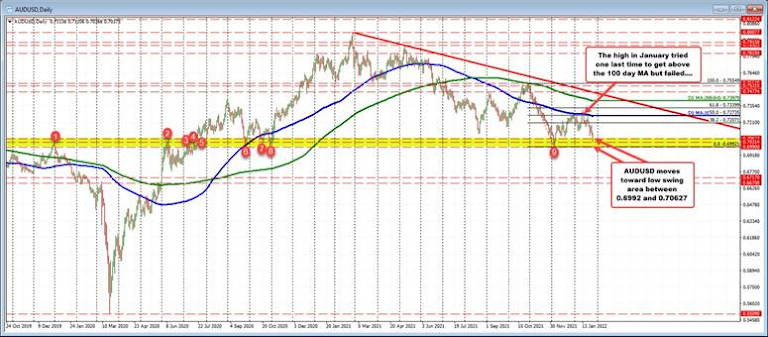
 The AUDUSD is trading to a new session low. Risk off sentiment is kicking in as the Nasdaq is now down -93 points and the S&P has also now turned negative on the day. The Dow is holding onto a 60 point gain.

Looking at the daily chart, the pair has entered into a swing area between 0.6992 and 0.70627. That area goes back to the end of 2019. In early November 2020, the pair bottomed one last time in that area before moving higher (peaking in February of 2021) at 0.75544.


Since that cycle high, the pair has steadily moved back down, ultimately retesting the 2019/2020 swing area in December 2021. The subsequent bounce higher saw the 100 hour MA stall the rise in early January 2022. On January 13, a try above the 100 day MA failed. The price retested the level last week, but again found sellers. Buyers turned to sellers again. The 100 day MA currently come in at 07264.

Drilling to the 4-hour chart below, the pair has most recently moved away from a lower swing area between 0.7080 to 0.7090 (see green numbered circles on the chart below). That area is now close risk. Stay below keeps the sellers more in control with the low target from the daily at 0.6992 (the low in December reached 0.69935 before bouncing), the next key target. Move below it, and the door opens more to the downside.

 FOREX ADVICE CLUB: Forex advice club  have the fastest team of FX analysts anywhere. Instantly knowing what headlines and levels matter

Tuesday, 26 October 2021

Weekly Overview on Currencies

 Currencies


MARKET VIEW


Weekly changes: EURUSD +0.61%, GBPUSD +0.28%, USDCAD +0.13%


EURUSD closed the week at 1.16425. The pair reached the 1.1670 mark twice but declined both times from the strength of the current resistance level.


GBPUSD ended Friday at 1.37551. The pair traded modestly within a week, having risen 2.4% in the previous fortnight.


USDCAD closed the week at 1.23583, the same spot as the Friday ago. The oil stepped from its three-year high, giving the Canadian dollar space to consolidate.


BULLISH TRIGGERS


The U.S. dollar eased after Powell's comment, enabling EURUSD to advance near the 1.1650 level. However, the eurozone inflation expectations are at their highest levels in years. This puts additional pressure on the ECB and its monetary policy agenda meeting this week.


GBPUSD changed insignificantly. The British pound fluctuated due to the country's various economic releases but remained bullish by late Friday. Early in November, the BoE is expected to be the first major central bank to lift its interest rate.


BEARISH TRIGGERS


The USDCAD finished the week flat, slowing its monthly-long decline. The BoC interest rate decision meeting this week might propose another round of tapering. Two days later, Canada will release its GDP data. The central bank's choice of tight or dovish tone of voice, followed by the solid or weak data, will determine USDCAD behaviour this week.

We provide Best forex Trading Signals with technical and fundamental analysis.

Friday, 3 September 2021

Overview on XAUUSD by Money Life Research

  The gold market price underwent a horizontal movement after the rise that took place last week, since this horizontal movement has been lingering since the market opened earlier this week.  Today look at the trends and reactions of the market.  Chances are it will drag on until the market shows the next reaction.


 On the chart, yesterday’s price is only testing at the next highest price where the resistance has been successfully broken at the price of 1800.00


 The continuation, at the current price now at 1815.00, this is the highest price yesterday.  What potential is seen can happen.  There are 2 probabilities that can occur at the current price.


 On my observation on the chart, the first thing that can happen is a rejection in the m15 timeframe because at the price of 1815.00 is the nearest resistance accompanied by a trendline confluence that was retested a few minutes ago.  So through this probability, a potential downtrend can occur.


 The second is a breakout at the price of 1815.00 and the fixed price continues to rise at least on hitting the price of 1825.00.  This is because in the past trend the downtrend still dominated the market price only after the increase took place, now the price makes a horizontal movement.  So a horizontal movement like this is no problem to buy and sell at the lowest and highest prices.


 If I do an entry sell, the risk and reward that I will take is between 1: 1.5-1: 3


 👉🏻Follow us to always know the science of trading as well as the latest updates on technical analysis & fundamental analysis at www.moneylifeconsulting.com

Saturday, 29 May 2021

The Best Forex Trading Strategies that work in 2021


A forex trading strategy will help you to decide when to buy and when to sell a currency pair. This involves studying the fundamental and technical factors. So when it comes to choosing the best forex trading strategy, we would tell you that there is no single answer to this. All the forex trading strategies are unique and what might work for one investor might not work for another investor.

Things to be Considered Before Considering Forex Profit Strategies

While considering the best forex trading strategy for yourself, you should consider the following factors.

#1. Your Time Horizon

Are you investing for short-term, medium-term or long-term/

#2. Your Risk Bearing Capacity

What are the profit and loss targets that you have set in the forex market?

#3. Your Trading Style

Are you an Intraday trader or buy-and-hold trader?

After considering all of the above factors it is important to choose the best forex trading strategy that works for you.

Here is a list of trading strategies that work:

1. Price Action Trading

2. Range Trading

3. Position Trading

4. Trend Trading

Wednesday, 12 May 2021

Top Forex News by Money Life Research

 🌈 Notable facts and economic data today


 - Today, UK will publish the initial value of the first quarterly GDP annual rate.

 - Today, the IEA publishes the monthly crude market report.

 - Today the US will announce the unadjusted annual CPI rate in April, which is expected to be 3.6%.

 - Today, Fed Vice President Clarida will attend the National Business Economics Association's Global Forum on post-translation global economies to host a discussion.

Subscribe to #MoneyLifeResearch #ForexSignals #BestForexSignals Live Forex Signals

Friday, 7 May 2021

Comment on Gold on May 7, 2021

  ‼️ ️In yesterday's session, gold precious metal had a fairly strong growth span from 1781 to 1817 ($ 36) and closed the session yesterday with a bullish candle that surpassed the resistance zone 1800-1804  and heading towards the next resistance around 1821-1825.

 - D1 timeframe we can see when a resistance is broken it turns into a new support zone and we wait for the price to come back to buy but in my opinion the possibility of a rally.  In the beginning of the session today, it is a bit difficult to happen, but in my opinion, if Gold returns here, the possibility of yesterday's trading day will be a "fake breakout" and will go down again.

 - Tonight, the US announced the Nonfarm payroll report for April and closed the weekly candle, so I think there will be 2 possible scenarios.  Firstly, Gold may move sideways to continue its uptrend, break up to the 1821-1825 price range, and then decrease again.  The second is that this metal is likely to fall to its sideways price zone that it broke yesterday to become a "fake breakout".

Subscribe to #MoneyLifeResearch #ForexSignals #BestForexSignals Live Forex Signals

Wednesday, 17 February 2021

SPY ETF has seen a net outflow- Money Life Research

SPY ETF has seen a net outflow of nearly $ 9 billion since Jan. 1.


 Gold lost its attractiveness as it continued to decline and investors left the GLD ETF


Up to now, BIL, TLT, and GOV have received a total cash flow of more than $ 2.2 billion.  At the same time, US10Y yields rose to their highest level since late February 2020.


Change in the data of ETFs + price action + stable fundamentals = Little evidence of sudden reversals in macroeconomic trends that are happening in recent weeks.

Get More Updates 

Monday, 1 February 2021

Latest Update on Gold Price- Money Life Research

‼ ️ At the top of last trading week World gold had 1 trading week mainly decreased. Gold price retested the 1875 resistance level then fell back within the last session of the week. Closing last week with a bearish candlestick showed that purchasing pressure began to hamper after subsequent week of gains. In my opinion, the resistance zone of 1867-1875 continues to be the zone that pushes the gold price down within the first sessions of in the week .

- Switching to the daily chart time-frame we will see that after 4 trading days at the start of last week declined, the last session of the 6th week, Gold price had a robust bounce to 1875 but after hitting the zone. At this price, Gold price fell immediately to 1840 and closed the day with a bullish candle but with an extended upper shadow, so this uptrend in my opinion isn't sustainable, reinforcing the trend of expecting retesting. on week time-frame .

- Considering on a shorter time-frame than H4, the closest point we will establish a sell-down position on the valuable metal Gold is around 1860. The safe target will remain to the old price of 1834. this is often also the support price zone of gold valuable during the day.

Saturday, 30 January 2021

Silver, Gold Forcast for Next Week: BULLISH

  • Last summer Gold prices went into an aggressive bullish breakout, eventually setting a fresh all-time-high in early-August.
  • Since then, however, Gold bulls have been on their back feet as prices have spent most of the past six months in varying forms of digestion.
  • More recently, Silver prices have been getting the attention from metals bulls, along with the Reddit crowd which has helped to prod the bid throughout this week.


When investors look to hedge against governments or monetary policy or even just the prospect of fiat debasement, they’ve long looked to the most precious of precious metals to hold as a store of value. I’m of course talking about Gold, and its role in economics spans back for pretty much as long as we’ve followed economics. This helps to explain Gold price action from last summer when prices were flying higher in response to the Fed’s actions devised to offset slowdowns from the coronavirus pandemic. Gold prices began to surge in June and by August, prices had jumped up to a fresh all-time high of $2,075. But that’s when the proverbial music stopped in the breakout; price action began to digest and here we are almost six months later and bulls remain in wait.


Silver prices, however, have received a recent shot-in-the-arm, and with some help from the same Reddit crowd that roiled many equities this week put in a strong topside breakout up to a fresh 2021 high. I wrote about this on Thursday, highlighting the deeper breakout potential that remained in the matter, and that theme continued through Friday trade with Silver prices jumping up to test trendline resistance.

Gold Signals Service


Remarketing tags may not be associated with personally identifiable information or placed on pages related to sensitive categories. See more information and instructions on how to setup the tag on: http://google.com/ads/remarketingsetup --------------------------------------------------->