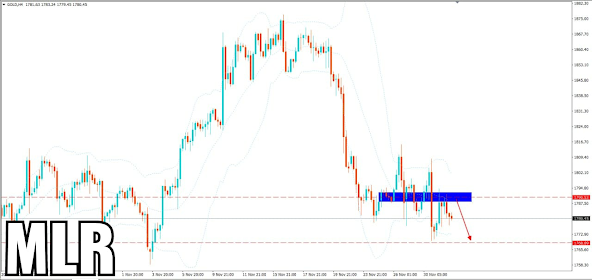
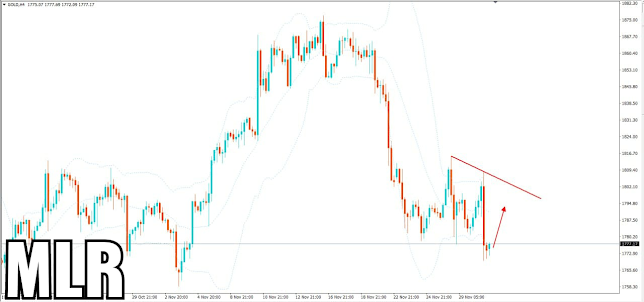
- In yesterday's trading session, Gold rose exactly as analyzed when it rose from 1824 to 1835 ($11) and closed the session with a bullish candle around 1833. However, the uptrend is dominant. dominant but in my personal opinion Gold will probably have a slight correction here.
- We can easily see that the precious metal Gold is at the resistance area around 1835, this is a relatively strong resistance area so it will not be suitable to establish a buy.on with Gold anymore. In my opinion here we can set up a small short position on this precious metal, target 1825-1820. When Gold reaches around the 1820 threshold, we will begin to consider the option to buy in with this precious metal.Before enter into the SGX Stock market it is necessary to get the further stock update, news & Stock Signals and recommendations for direct investment.
Thursday, 10 February 2022
Monday, 7 February 2022
Today Gold Prediction on February 7, 2022:
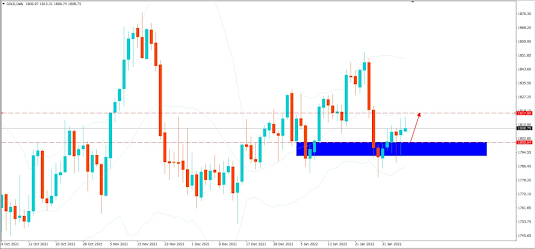
- In the last trading week, we can see the precious metal Gold was mainly sideways in the range from 1788-1815, closing the week session with a bullish candle around the 1807 price range. With this week's candle. If it doesn't drop like the previous week, plus it closes with a bullish candle, in my opinion Gold will continue to move sideways and accumulate in a wide range.
- Switching to the daily chart time frame, we can see that the past week has been a continuous period of retreating candles, showing that the buying power is quite good when the price corrects around the 1794-1800 zone, so in my opinion My personal point if in today's trading session Gold has a correction near the upper price zone, that is a good price zone so we can establish a buy position with a safe target of 1818 and far. than 1825.
Friday, 4 February 2022
Make yourself a better trader at all market :
True in Trading too. It is difficult to make easy profits following the crowd. Make yourself a better trader at all market conditions by learning and backtesting the unique trading startegies
Applicable for Traders while holding any trade positions. Agree?
Ask yourself:What do you feel while holding your trade positions?
How to Control your Emotions in trading?
✅You can reduce your trading account leverage to 1:100 and give the password access to your friend or loved one and tell them to change it. (password access for your brokerage website where you can change leverage)
Now you are going to trade with a small lot size. This will help you to self improve yourself in handling emotions for taking high lots.
Be patience with this process. You will definitely see a good result.
We always want you to trade safe at all the market conditions.
Those who think - You feel fear, frustration, anxiety, impatience, tension, etc. while holding the trade positions.
Please ask yourself : How can you reduce this?
If you use a small lot size, can you reduce your fear, anxiousness, impatience...?
If you behave well using a small lot - that would be great.
Use small lot size at all the times. when you feel confident about the trade setup, you can increase your lot size. but don't be over confident.
Wednesday, 2 February 2022
DAILY NEWS HIGHLIGHTS! On 2 February 2022
π Metaverse real estate sales top $500 million, and are projected to double this year. So far, real estate sales have been concentrated on the “Big Four” — Sandbox, Decentraland, Cryptovoxels and Somnium.
π Sony to buy video game maker Bungie in $3.6 billion deal as industry consolidation heats up. Bungie is behind the multiplayer shooter games Destiny and Halo, the latter of which it developed until 2010. Technology companies are increasingly interested in gaming as they look to expand audiences and prepare for future iterations of virtual- and augmented-reality devices.
π China plans crewed moon mission, tourism and Jupiter exploration in space race with the U.S.. China has had some notable space successes in the past few years including launching an uncrewed mission to Mars and beginning construction of its own space station.
π Covid-19’s Economic Fallout Batters Latin America. The region is bracing this year for rampant inflation, low growth and high interest rates that spell hardship for tens of millions of people in poverty as businesses struggle to survive.
π Bond Market Hints at Calm After Disruptive Selloff. Yields on longer-term U.S. government bonds have shown signs of stabilizing in recent days, easing the pressure generated on stocks by their rapid early-year climb.
Tuesday, 1 February 2022
πDAILY NEWS HIGHLIGHTS! π Date: 1 February 2022 :
ππ Cryptocurrency exchange FTX hits $32 billion valuation despite bear market fears. FTX, which offers derivatives products as well as spot trading, is one of the world’s largest digital currency exchanges. FTX has built up a war chest of funds at a time when crypto prices have sunk considerably.
π U.S., Russia Square Off in Rare U.N. Security Council Debate. The U.S. criticized Russia about its buildup of troops near Ukraine and sought to isolate Moscow on the international stage over the military standoff.
π Fed’s Policy Shift Ripples Through the Housing Market. The central bank had been the biggest buyer of mortgage bonds, but now it is stepping back and borrowing costs are rising.
π Russia-Ukraine Tensions Drive Global Wheat Prices Higher. The two nations account for just under a third of global wheat exports, much of which goes to the Middle East to keep bread prices affordable.
π Caribbean Digital Currency, DCash, Remains Offline for Second Week. Launched in March, DCash is used by seven Caribbean nations. The Eastern Caribbean Central Bank launched DCash, making it the first monetary union in the world to use a central bank digital currency, or CBDC.
Thursday, 30 December 2021
π Gold comment on December 30, 2021:
- Closing yesterday's session, precious metal Gold ended with a long bearish candle. With a long-legged withdrawal like this, it is likely that in today's session, the uptrend will return. So in my opinion in today's trading session, we will prioritize buying option.
- Switching to the h4 time frame we can see that Gold from the 1798-1802 price zone is a good support to establish a buy position with this precious metal. The nearest target is around 1809 and is expected to retest the 1818-1820 zone.
Monday, 27 December 2021
Analaysis on Gold
At the end of the last trading week, precious metal Gold had another week of new growth when the price bounced up from 1784 to 1810, closing the week at around 1808. In my personal opinion, Gold is still is being blocked by the resistance area of 1810-1815, so it is likely that in the beginning of the week's session there will be a slight correction, the condition for the increase to continue is to overcome this price area.
- Switching to the H4 time frame Gold is forming a double top pattern. We can short-term at the current price range with safe profit-taking around 1800-1803. Here we liquidate the order and wait for the next signal.
Register: https://bit.ly/3xYiZ24
Monday, 20 December 2021
GOLDEN MARKET: Forex | Comex | Stocks
☘️The price of gold in the international market has increased and decreased unpredictably according to the evolution of updated information on the mutation of the Omicron virus.
☘️Investors are insecure because of new information about the Omicron mutation and negative fluctuations in the world financial market.
The CEO of Moderna believes that Omicron reduces the effectiveness of the vaccine. Accordingly, the world will take many months to develop and ship a specific vaccine with the Omicron strain. However, more time is needed to determine exactly how the Omicron variant affects the vaccine's effectiveness.
☘️The USD dropped sharply and world stocks simultaneously dropped, which was the factor that pulled the gold price up.
The new Covid-19 variant was first detected in South Africa and has appeared in more than a dozen countries, prompting many countries to re-enact travel restrictions. The World Health Organization (WHO) classifies Omicron as a variant of concern, on the same level as the Delta variant.
US Federal Reserve Chairman Jerome Powell believes the Omicron variant poses a threat to the Fed's mandate to stabilize prices and maximize employment.
Gold is under pressure from the possibility that the US Federal Reserve (Fed) accelerates the plan to tighten monetary policy to fight inflation.
However, the precious metal commodity is supported by the unpredictable variables of the new virus strain.
Fed Chairman Jerome Powell has just said that the Omicron mutation puts pressure on the US economy and complicates the inflation picture.
For More Information and Updates: Signup
Tuesday, 14 December 2021
π Comment on Gold on December 14, 2021
After bouncing up to 1791 Gold fell exactly as analyzed in 1782 and sideway at this price range. Closing the day session with a bullish candle around 1786. With this precious metal still flat, not much breakout yet so my personal view remains the same, we can trade. within this range.
- Maintain a sell signal around 1790 as a strategy and consider buying around 1770. If Gold breaks one of these two price zones, we will wait for a pullback and then follow that trend.
Register: https://forms.gle/hpwZr5c85T55kPNG7
Monday, 13 December 2021
π Comment on Gold on December 13, 2021
In the last trading week, precious metal Gold was almost flat in the range from 1792-1770. Closing the weekly candle with a bearish candle, but this bearish force doesn't say much. With Gold accumulating waiting for a new trend, in my opinion at the beginning of today's session we can trade within this range.
We will wait to sell around the 1795 price zone and consider buying around 1770. If Gold breaks out of one of these two price zones, we will wait for a pullback and then follow that trend.
Friday, 10 December 2021
Xauusd Overview
XAUUSD H1
Price pressure made the market yesterday move in a downtrend and break the support level for last Wednesday. The downtrend starts from the test price at the resistance area of 1790.00 despite moving in a horizontal position.
Today's market price opened below the support level of 1776.00 and there was a pullback early this morning until testing in the area of SBR 1779.00
Through the trend of the market price for the beginning of this morning, the price movement shows a downward trend. From the current candlestick, there is a price decline to form a shooting star in the H1 timeframe.
The nearest support and resistance price areas today are at:-
R1: 1779.00
R2: 1785.00
R3: 1795.00
-----------
S1: 1773.00
S2: 1767.00
S3: 1757.00
Trading is currently encouraged to look at a low timeframe to see the best trading potential to buy or sell. All these trades need to be done using the amount of "initial capital" that is willing to risk.
Finally, to see more active movement it is recommended to wait for trading opportunities in the evening. Have a safe trade.
Thursday, 2 December 2021
Comment on XAUUSD on December 2, 2021
The tendency of the price in the downtrend on the current chart after the price tested the resistance level of 1789.00 and closed below the price making the movement dominated by the downtrend.
Now the price which is in the small support area at 1777.00 shows a horizontal movement after the price earlier this morning broke the support area yesterday.
From this reaction, the price is likely to be able to continue the downtrend for today and here I attach the nearest support and resistance levels to see the potential of the current movement:-
R1: 1783.00
R2: 1789.00
R3: 1799.0
S1: 1777.00
S2: 1771.00
S3: 1761.00
Trading is currently encouraged to look at a low timeframe to see the best trading potential to buy or sell. All these trades need to be done using the amount of "initial capital" that is willing to risk.
Get Free Gold signals Now: https://forms.gle/hpwZr5c85T55kPNG7
Wednesday, 1 December 2021
Comment on Gold on December 1, 2021:
After a strong rally to 1877 at the beginning of the month, at the end of November, the precious metal Gold retreated quite strongly, closing the monthly candle with a long-haired bearish candle, almost covering up all previous upward pressure. With this closing, in my opinion, Gold has returned to its cumulative price range and has not yet had a clear new trend.
- On the daily chart time frame we can see in the last trading hours of November Gold has dropped to 1769, this is a strong support area for the precious metal Gold and I expect early in the session. trading today Gold may recover after the strong drop last night. The safe target to take profit is around 1785-1790, here we wait for the next signal.
- As I have mentioned many times before, only when Gold closes above 1800-1805 will there be a possibility of regaining momentum and below that is the 1760-1765 support area, if Gold breaks further. If we continue to continue this support price zone, we will be able to continue falling and then we will update the price channel again.
Gold signals: https://forms.gle/hpwZr5c85T55kPNG7
Tuesday, 30 November 2021
Comment on Gold on 30/11/2021
Yesterday after precious metal Gold bounced back and recovered near 1800, fell sharply to 1781, closing the day's session with a bearish candle around 1784. This is the 5th day in a row that Gold can't fall through. passed the support price zone 1775-1785, so in my opinion, Gold will have a recovery span when it returns to this price zone.
- Moving to the H4 time frame, we can see that every time Gold reaches this price level, the candle usually reaches the upper support area, withdraws and bounces back, plus 1 thing is that after the past 2 weeks of decline, today Today is the last trading session of November so there is a possibility that there will be a profit-taking rhythm so there is a possibility that there will be strong movements for Gold in the US session tonight and my point of view is to prioritize the option to buy at the closing level. Safe words are 1800-1805.
Thursday, 25 November 2021
π Gold comment on November 25, 2021
After 4 consecutive dropping sessions, precious metal Gold yesterday started to show signs of slowing down when ending the day with a long bearish candle. And to confirm the bullish reversal signal, in my opinion Gold needs to close the daily candle with a bullish green candle with strong upward force to form a reversal pattern around this price area.
- On the h4 time frame, we can see that Gold is showing signs of recovery and this recovery in my opinion is likely to reach around 1800-1805 and people can buy up here. At the price zone Now, we liquidate the order and wait for a signal at the level of 1800-1805, the price area that I have mentioned many times is a psychological resistance area and Gold needs to pass to confirm the reversal signal. . If Gold breaks through here, I will continue to update the signal.
For daily Signals: SignUp>>>
Wednesday, 24 November 2021
US discharges oil storage: Latest Update
The United States will release 50 million barrels of crude oil from its Strategic Petroleum Reserve along with China, Japan, India and South Korea, the White House said in a statement - an unprecedented effort that included coordination of the largest oil consumers to tame prices. The decision to collectively "discharge" crude inventories after OPEC+ countries rejected calls to significantly boost output marked a diplomatic victory for the United States and challenged Saudi Arabia, Russia and other OPEC+ producers in the market.
WTI oil prices are down 1.45% on the day to $75.64/barrel.
Get a potential crude oil signal to trade with technical and fundamental analysis
Join us: https://forms.gle/hpwZr5c85T55kPNG7
Friday, 19 November 2021
Powerful Gold Trading Tips for Every Trader in 2022

Gold, the yellow metal has long been considered as the king of all commodities. Many investors consider investment in this metal as an essential part of their portfolio. In this article, we will share the gold market fundamentals that you should know before trading gold. We also will share some powerful gold trading tips that will help you to generate good returns in 2021.
We always recommend you to use the services of a good broker while trading gold, stocks, or commodities. These brokers can give you some good gold signals and tips before entering the market. Gold is a fantastic commodity to start trading and one good investment option to diversify your portfolio.
What Causes Movements in Gold Prices?
Like any other market, price fluctuations in the gold market are caused due to changes in demand and supply. In times of recession, people look for safe-haven investment ideas, this causes more demand for gold. Investors rush to trade gold in order to decrease the losses caused in stock market trading or for the purpose of hedging their investment. This causes an increase in the price of gold.
Effects of Risk Aversion on Prices of Gold
The risk-on- risk off factors have a huge role to play in the prices of gold. As investors in case of a recession in the economy prefer low-risk instruments to hedge their assets. This causes a huge rush towards safe investments like gold. Risk aversion causes an increase in the prices of gold as the investors are seeking for this safe investment.
Can USD Impact Prices of Gold?
In the global economy, gold is priced as USD/Ounce. So it is very logical that the strength and weakness of the dollar will impact the prices of gold. To be specific we can say that gold prices increase when USD is sold, this is because gold becomes more expensive in this case. Alternatively, gold prices tend to decrease when USD is bought in large quantities.
Performance of Gold During COVID-19
Generally, gold performs well during a global economic crisis. In pandemics and epidemics, investors learn how to trade gold due to the safety of the investment. The stock market in this situation falls down resulting in a shift from risky assets to safe-haven investments. During COVID-19 gold prices broke the records and reached to its maximum limit initially. But subsequently, prices came back to normal.
Let's have a trial on Gold Trading
Register for profitable gold signals now: https://forms.gle/hpwZr5c85T55kPNG7
Thursday, 18 November 2021
π Comment on Gold on 11/18/2021
In yesterday's trading session, precious metal Gold bounced up according to the analysis from 1849 to 1868 ($ 19), after reaching this price zone, precious metal Gold has not shown any signs of correction, instead saw a good increase in strength, closed the session with a strong bullish candle around 1867 that concealed all the decreasing force of the previous candle next to it and in my opinion it is likely that in today's session the uptrend will still be maintained.
Moving to the H4 time frame we can see that the downward force is almost negligible and this high resistance area of 1870-1877 is unlikely to hold so in the beginning of today's session if the precious metal Gold has If there is a slight correction, this is a good price area for us to buy with a safe target around 1877 and beyond 1882-1888.
Register for daily gold signals and updates.
Wednesday, 17 November 2021
Comment on Gold on November 17, 2021
In yesterday's session, after a fake breakout to 1877, precious metal Gold immediately fell to 1849 ($28), closing the day session with a strong bearish candle around the 1849 price zone. With this decrease, in my opinion, precious metal Gold will continue to correct in today's session.
Moving to the H4 time frame we can see the precious metal Gold is currently reacting at around 1849, I expect here Gold can recover to around 1860-1866 in early trading today. now on. After touching this price zone, the precious metal Gold is likely to be under downward pressure, so I will update everyone's signal.
Register Now: https://forms.gle/hpwZr5c85T55kPNG7
Friday, 12 November 2021
How To Boost Your Trading Success Rate
Do you feel like your trading capabilities are stuck in a rut? Do you wish you could find some new and different approaches to making a profit by buying and selling your favorite instruments like forex currency pairs, stock shares, bonds, index funds, options, futures, commodities, and more? The silver lining inside the dark cloud of trading inertia is that there are indeed many techniques that can help you do better. What are the specific approaches you can use to become more skilled at what you do and earn more money in the long run? Here are a few of the tried and true strategies that people have been using to good effect for many years. Give one, some, or all of them a try and see if they make a difference.
Learn Technical Analysis
There are dozens of widely used technical indicators, all of which have their own unique and instructive powers. By far, the most common is the moving average. The SMA, or simple moving average, merely shows the result of adding together several days’ worth of price data and graphing it in such a way that we can see the big picture of price behavior. You probably know of the most popular of these indicators: the 50-200 crossover. What is it? It implies that prices are headed upward when a stock’s 50-day moving average (MA) crosses above its 200-day MA. In general, you can test out this theory on your favorite securities and see if prices rose after such a crossover. Some traders swear by this theorem and stay out of the market completely, as a safety precaution, when the 50-day MA is below the 200-day MA.
One of the most popular indicators is called MACD, which stands for moving average convergence divergence. It’s a convoluted name for a simple straightforward mathematical concept. Without going into minute detail, we could use an example of MACD trading strategy to illustrate the point. Keep in mind that the MACD is often used by traders who want to stay on the correct side of a trend. There’s a general rule to never buy a security when the price chart shows the MACD below its zero line and shows the trigger line above the generic convergence line. If that sounds complicated, don’t worry. It isn’t. Your platform’s charting software will calculate all those variables for you. That way, if XYZ’s share chart shows today’s MACD as being below the zero line, while its trigger line is above the generic line, you are receiving a warning: “Do not open a long position in XYZ stock today.”
Read About Market Psychology
There are some classic books out there, many of which are in the public domain, which means you can pick them up for no cost. Others are widely available and come with reasonable price tags. Spend time studying the general topic of market-based psychology as it pertains to buying and selling for a profit. Pay particular attention to sub-topics about personal behavior and warning signs that you are falling into a bad pattern of activity, like over-trading, investing money you can’t afford to lose, and being guided by your emotions instead of logic.
Study the Basics of Fundamental Analysis
Fundamental analysis is everything other than chart-based theory. In other words, the fundamental approach says you should look at a company’s underlying strengths and weaknesses rather than recent or long-term price behavior. For example, you examine things like whether the business has released any new products, what their current level of earnings is, the past performance of its executives if there are any pending lawsuits against the organization, etc.
Practice and Back-Test
Don’t neglect to put your newfound skills to the test. Consider using the simulator on your platform to make some fictitious buys and see how you do when employing fundamental, technical, and intuitive analysis. Start using a daily diary to log all your activities, feelings, and attitudes. Finally, use the simulator to experiment with using the MACD method and see if you can get a feel for how particular security is moving based on its moving-average information. It’s always possible to do some back-testing by reviewing historical price movement and see if you would have been able to predict it by using one or another technical indicator.
Try our Free accurate signals to trade and live trading recommendations.
Register Now https://forms.gle/hpwZr5c85T55kPNG7