Showing posts with label gold trading signals. Show all posts

Tuesday, 14 December 2021

📕 Comment on Gold on December 14, 2021

 After bouncing up to 1791 Gold fell exactly as analyzed in 1782 and sideway at this price range.  Closing the day session with a bullish candle around 1786. With this precious metal still flat, not much breakout yet so my personal view remains the same, we can trade.  within this range.


 - Maintain a sell signal around 1790 as a strategy and consider buying around 1770. If Gold breaks one of these two price zones, we will wait for a pullback and then follow that trend.

Register: https://forms.gle/hpwZr5c85T55kPNG7

Monday, 13 December 2021

📕 Comment on Gold on December 13, 2021

In the last trading week, precious metal Gold was almost flat in the range from 1792-1770.  Closing the weekly candle with a bearish candle, but this bearish force doesn't say much.  With Gold accumulating waiting for a new trend, in my opinion at the beginning of today's session we can trade within this range.


We will wait to sell around the 1795 price zone and consider buying around 1770. If Gold breaks out of one of these two price zones, we will wait for a pullback and then follow that trend.

Friday, 10 December 2021

Xauusd Overview

 XAUUSD H1

 Price pressure made the market yesterday move in a downtrend and break the support level for last Wednesday.  The downtrend starts from the test price at the resistance area of ​​1790.00 despite moving in a horizontal position.

 Today's market price opened below the support level of 1776.00 and there was a pullback early this morning until testing in the area of ​​SBR 1779.00

 Through the trend of the market price for the beginning of this morning, the price movement shows a downward trend. From the current candlestick, there is a price decline to form a shooting star in the H1 timeframe.

 The nearest support and resistance price areas today are at:-

 R1: 1779.00

 R2: 1785.00

 R3: 1795.00

 -----------

 S1: 1773.00

 S2: 1767.00

 S3: 1757.00

 Trading is currently encouraged to look at a low timeframe to see the best trading potential to buy or sell.  All these trades need to be done using the amount of "initial capital" that is willing to risk.

 Finally, to see more active movement it is recommended to wait for trading opportunities in the evening.  Have a safe trade.

Wednesday, 1 December 2021

Comment on Gold on December 1, 2021:

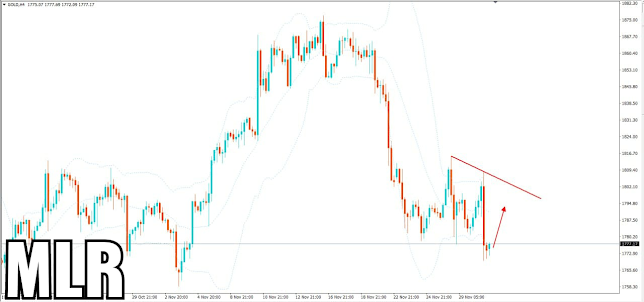
 After a strong rally to 1877 at the beginning of the month, at the end of November, the precious metal Gold retreated quite strongly, closing the monthly candle with a long-haired bearish candle, almost covering up all previous upward pressure.  With this closing, in my opinion, Gold has returned to its cumulative price range and has not yet had a clear new trend.


 - On the daily chart time frame we can see in the last trading hours of November Gold has dropped to 1769, this is a strong support area for the precious metal Gold and I expect early in the session.  trading today Gold may recover after the strong drop last night.  The safe target to take profit is around 1785-1790, here we wait for the next signal.

 - As I have mentioned many times before, only when Gold closes above 1800-1805 will there be a possibility of regaining momentum and below that is the 1760-1765 support area, if Gold breaks further.  If we continue to continue this support price zone, we will be able to continue falling and then we will update the price channel again.

Gold signals: https://forms.gle/hpwZr5c85T55kPNG7

Friday, 19 November 2021

Powerful Gold Trading Tips for Every Trader in 2022

 Powerful Gold Trading Tips for Every Trader in 2021


Gold, the yellow metal has long been considered as the king of all commodities. Many investors consider investment in this metal as an essential part of their portfolio. In this article, we will share the gold market fundamentals that you should know before trading gold. We also will share some powerful gold trading tips that will help you to generate good returns in 2021.

We always recommend you to use the services of a good broker while trading gold, stocks, or commodities. These brokers can give you some good gold signals and tips before entering the market. Gold is a fantastic commodity to start trading and one good investment option to diversify your portfolio.

What Causes Movements in Gold Prices?

Like any other market, price fluctuations in the gold market are caused due to changes in demand and supply. In times of recession, people look for safe-haven investment ideas, this causes more demand for gold. Investors rush to trade gold in order to decrease the losses caused in stock market trading or for the purpose of hedging their investment. This causes an increase in the price of gold.

Effects of Risk Aversion on Prices of Gold

The risk-on- risk off factors have a huge role to play in the prices of gold. As investors in case of a recession in the economy prefer low-risk instruments to hedge their assets. This causes a huge rush towards safe investments like gold. Risk aversion causes an increase in the prices of gold as the investors are seeking for this safe investment.

Can USD Impact Prices of Gold?

In the global economy, gold is priced as USD/Ounce. So it is very logical that the strength and weakness of the dollar will impact the prices of gold. To be specific we can say that gold prices increase when USD is sold, this is because gold becomes more expensive in this case. Alternatively, gold prices tend to decrease when USD is bought in large quantities.

Performance of Gold During COVID-19

Generally, gold performs well during a global economic crisis. In pandemics and epidemics, investors learn how to trade gold due to the safety of the investment. The stock market in this situation falls down resulting in a shift from risky assets to safe-haven investments. During COVID-19 gold prices broke the records and reached to its maximum limit initially. But subsequently, prices came back to normal.


Let's have a trial on Gold Trading

Register for profitable gold signals now: 
https://forms.gle/hpwZr5c85T55kPNG7 

Tuesday, 9 November 2021

Comment on Gold on November 9, 2021

After falling to 1812 Gold immediately bounced up as expected to 1825, closing yesterday's session with a bullish candle around 1823. With the end of the day continued with a bullish candle like this.  the possibility that the uptrend will not stop and will continue to increase in today's trading session.


Switching to the H4 time frame if mn has liquidated to take profits, in the beginning of today's session, we can set a buy status around 1815-1819 so we can consider buying with the target.  Target higher than 1830-1833 in today's trading session.

Register Now for more forex and gold signals https://forms.gle/hpwZr5c85T55kPNG7 

Monday, 8 November 2021

📕 Comment on Gold on November 8, 2021

In the last trading session of the last week, precious metal Gold has gained quite strongly as analyzed, closing the week with a strong bullish candle around the threshold of 1818. With the closing of the week with a full-strength bullish candle.  At this point, my personal opinion at the beginning of this new week's trading session is to prioritize buying options.


 - Switching to the daily chart, we can also see that the buying pressure of the last 2 days is quite strong and in the support zone, the nearest precious metal can be found around 1804-1808.  If the precious metal in the beginning of today's trading session can correct slightly, the upper price zone is a good price zone for us to establish a buy position on the precious metal Gold with my expected target is  around the threshold of 1825-1830.


Register Now: https://forms.gle/hpwZr5c85T55kPNG7

Friday, 29 October 2021

📕 Comment on Gold on October 28, 2021

 Ending yesterday's session, precious metal Gold had 1 day of gain as analyzed when from 1783 to 1799, closing the day around the threshold of 1796. Although closing the session with a bullish candle, look at it.  Overall yesterday Gold ran in two directions and has not yet broken the psychological resistance around 1800.


Switching to the H4 time frame we can see that after many tests of 1784 the price bounced up quickly to the resistance around 1800. Currently, the above two price zones are still holding and showing no signs of breaking.  My personal opinion is that at the beginning of today's trading session we can trade within this range and wait for the signal to break for the next trend.


Register Now: https://forms.gle/hpwZr5c85T55kPNG7

Thursday, 28 October 2021

Comment on Gold on October 28, 2021

  - Ending yesterday's session, precious metal Gold had 1 day of gain as analyzed when from 1783 to 1799, closing the day around the threshold of 1796. Although closing the session with a bullish candle, look at it.  Overall yesterday Gold ran in two directions and has not yet broken the psychological resistance around 1800.


 - Switching to the H4 time frame we can see that after many tests of 1784 the price bounced up quickly to the resistance around 1800. Currently, the above two price zones are still holding and showing no signs of breaking.  My personal opinion is that in the beginning of today's trading session we can trade within this range and wait for the signal to break for the next trend.

Register Now for daily comex tips https://forms.gle/hpwZr5c85T55kPNG7

Tuesday, 19 October 2021

Let's have an overview on Gold(XAUUSD)

 XAUUSD M15

The market today opened at the price of 1767.00 as well as making a $ 4 retracement of the increase from the opening price.  From the current chart what can be seen through the current movement.

From the chart analysis, the tendency of the market price shows more downtrend than uptrend.  Because the rise that took place early this morning did not show strength on this candlestick.

Even what is created at current prices?  Bearish engulfing has formed on the M15 timeframe.  This suggests the possibility of market prices tending to a downtrend.

But at the same time.  The price is in the flat area where the price was the lowest last Friday.  Chances are if a strong downtrend can occur it will need to break in that area.

This is an appendix to today’s support and resistance prices;

 R1: 1770.00

 R2: 1776.00

 R3: 1786.00

 --------------------

 S1: 1764.00

 S2: 1758.00

 S3: 1748.00

Those who want to see the breakout + retest chart can be guided by the M15 timeframe.  As well as 1: 1 trade management can be used as a management guide for today's trading.

Follow us to always know the science of trading as well as the latest updates on technical analysis & fundamental analysis

Visit: www.moneylifeconsulting.com

Wednesday, 13 October 2021

Xauusd Overview

XAUUSD H1

 The rise in the market price that took place yesterday after being tested at the opening price of 1754.00 did rise up to the level of 1769.00

 from this $ 15 increase is the market price today able to make an increase or even follow the original trend where the downtrend will occur following the big bearish in the past?

 From the current chart today, I see a rejection at the price of 1763.00 which is the first resistance area after the market opened this morning.  Continuing that, the price also has confluence on the trendline area in the M15 timeframe tested.

 These are the support and resistance levels of gold today:

 R1: 1763.00

 R2: 1769.00

 R3: 1779.00

 --------------------

 S1: 1757.00

 S2: 1751.00

 S3: 1741.00

 The price opened today at 1760.00, from Monday’s chart to the current market.  The majority of the movement is still in a horizontal position so looking from this potential, short term trading can be done in the following areas.

 Trading management 1: 1.5 to 1: 2 can be used as a guide to place a good risk reward in current trades.

 Follow us to always know the science of trading as well as the latest updates on technical analysis & fundamental analysis

www.moneylifeconsulting.com

Monday, 11 October 2021

📕 Comment on Gold on 11/10/2021:

In the last hours of last week's trading session, precious metal Gold had bounced to 1781 but then fell back to $26 to 1755, closing the day session with a bullish candle with a long beard.  along with it is also closing the weekly candle with a bearish candle.  With the closing of the weekly candle as well as the daily candle, it shows that the upward force is weakened, so in my opinion at the beginning of today's session, the selling pressure of this precious metal will appear, selling priority will be today's strategy.


 - Moving to the H4 time frame, we can see that apart from the last weekend's sweeping candle, the range is still in the sideways zone and has not shown any signs of breaking out.  So around 1765 is still an area where we can establish a sell position with the target being the lower band of this sideway 1750-1755.


Get High accuracy Gold signals with daily fundamental and technical analysis.

Register Now: https://bit.ly/3xYiZ24

Tuesday, 5 October 2021

Today's Gold Important News

Gold price forecast: Who’s up for a buy trade over $1,754?

Despite the various negative headlines, the price of the yellow metal failed to extend its previous three-day upward rally, turning sour around the $1,760 level, amid a stronger US dollar and a riskier market sentiment. Today, during the Asian trading session, the gold price failed to extend its upward trend, becoming depressed around the $1,760 level, as the US dollar gathered upside momentum on the day.

The US Dollar Index climbed from the lower levels to an intra-day high of around 94.00, making gold cheaper for holders of other currencies. Thus, the bullish bias in the US dollar was seen as one of the key factors that put some selling pressure on the dollar-denominated commodity, gold. In addition to this, the global equity markets have been flashing green since the day started, which tends to undermine the safe-haven metal prices. The risk sentiment was backed by the renewed hopes surrounding the US stimulus package.

XAU/USD

Currently, the yellow metal is trading at 1,760.06, and consolidating between 1,757.86 and 1,770.16. Moving on, traders seem cautious about placing any strong positions ahead of the Fed’s monetary policy meeting. A hawkish stance by the Federal Reserve would diminish the demand for gold. If the Fed raises interest rates, the opportunity cost of holding bullion, which pays no interest, will increase.Despite the faster spread of the delta variant of the coronavirus and the escalating US-China tussle, the market trading sentiment succeeded in putting a stop to its losing streak of earlier in the day, drawing some fresh bids for the day. The renewed hopes of an infrastructure spending package could also be supporting the stock futures. US President Joe Biden showed his willingness to trim the demand for infrastructure spending, which favoured the market sentiment in Asia.

Meanwhile, Japan’s new PM, Fumio Kishida, warmly welcomes global leaders, which indicates progressive tie-ups, as the global giants overcome the pandemic with faster jabbing rates. Peviously released economic data also increased optimism about the recovery of the US economy, which positively impacted the market trading sentiment. On the data front, US New Factory Orders came in above the forecasts, surging by 1.2% in August, which is well above the market forecast of a 1% rise. The positive appearance of US stock futures highlights the risk-on sentiment, which tends to undermine the safe-haven metal, GOLD.

Stronger US dollar weighs on gold

Despite the risk-on market mood, the broad-based US dollar maintained its early-day upward rally and remained well bid on the day. The US Dollar Index surged from the lower levels and stood strong near 94.00. The higher US 10-year benchmark Treasury Yields added to the upward pressure on the USD prices, which rose two basis points to 1.48%, after testing a high of 1.56% in June. In the meantime, the previously released upbeat US data also played a significant role in supporting the US currency. The rise in the value of the greenback kept bullion prices under pressure, as the price of the XAU/USD is inversely related to the value of the US dollar.

The long-lasting US-China tensions also got an additional lift after the US condemned Chinese activity near Taiwan. The remarks by US Trade Representative (USTR) Katherine Tai, who cited Beijing’s shortfall in meeting the phase one deal targets, also added to the drama. The suspension of trading in Evergrande stock in Hong Kong has fueled speculation that the bankrupt real estate firm is being sold to pay off debts.

Best Gold Trading New 

Friday, 1 October 2021

Let's have an look on XAUUSD

 XAUUSD M15


The rise occurred last night after the market price tested the support level of 1725.00 and failed to break and then passed a confirmation reversal on the M15 timeframe.  An increase of $ 40 occurred from the lowest price to yesterday’s highest price.


 So through today’s chart what is the potential that could happen at the current price at the moment?  I see from the trend of the market price which is dominated by the uptrend as well as there was a clear set up early this morning after the market-tested on the trendline area as well as at the price of 1752.00


 In addition, the market expects to continue the rise guided to the test level at the nearest resistance area between 1755.00 - 1752.00 and 1746.00


 This is one of the closest support areas that can be retraced because in the current situation the price has entered the horizontal zone.


 If choosing the current market to trade I advise to put confluence on every trade made so that you can see more clearly what will happen after that.


 From the overall picture the market can rise again up and there is a breakout at yesterday’s highest price in the event of a breakout at that level.


 Follow us to always know the science of trading as well as the latest updates on technical analysis & fundamental analysis


 www.moneylifeconsulting.com

Wednesday, 29 September 2021

Comment on XAUUSD H1 by Money Life Research

 Yesterday’s market price decline, occurred after a breakout that occurred in the support area with a morubozu candle on the H1 timeframe.


 So through the current chart now what can be seen through the current potential?  The current chart is uptrend after the market opened and did not pass yesterday's lows.


 Continuing that, I see this rise is a retracement that took place in the early morning and the possibility of the price being able to reach at 1743.00 where it is the closest resistance area to the current price.


 In addition, at the price there is a confluence where the support price and has a trendline drawn through the timeframe M15, so I will look at the chart if there is a reversal movement, the mark as an entry point will be done.


Accompanied by risk management between 1: 2-1: 3 can be taken at a lot fixed rate according to the available account capacity.


 The price seen as a whole has a breakout at the lowest price, it is likely that if the US session opens, traders can see an interesting movement through gold now, that is in case of momentum.


 Follow us to always know the science of trading as well as the latest updates on technical analysis & fundamental analysis


 www.moneylifeconsulting.com

Tuesday, 28 September 2021

Market Outlook: Gold/XAUUSD

 Gold inched higher shortly after the New York session on Monday despite a rise in Treasury yields and the U.S. Dollar. An overnight reversal to the downside in the U.S. stock indexes may be helping to underpin prices, but more than likely, the market may have found a sweet spot on the chart where it is neither too bullish nor too bearish.

- This pattern is a continuation event that pauses before it refreshes lower. Medium-term momentum has turned negative and generated a crossover signal.


Technical View 

- A sustained move over 1758 will indicate the presence of buyers. The first upside target is 1762.90. Taking out 1762.90 could trigger an acceleration into a resistance cluster at 1787 to 1788.

- A sustained move under 1758 will be the early sign of weakness.

https://www.moneylifeconsulting.com/

Weekly Overview on Oil by Money Life Research

 MARKET VIEW


Weekly changes: XBRUSD +4.34%


The oil prices are rebounding to multi-year highs. XBRUSD settled near a three-year high at 77.25 USD, its best level since October 2018.


BULLISH TRIGGERS


Oil demand will be growing steadily amid the ongoing economic recovery while the supply outlook remains stable thanks to production discipline by OPEC+. The latest EIA report shows that U.S. crude stockpiles declined for the seventh consecutive week. According to the U.S. Energy Information Administration, U.S. crude inventories fell by 3.5 million barrels last week. India’s oil imports hit a three-month peak in August.

 www.moneylifeconsulting.com


BEARISH TRIGGERS


There might be a significant downwards correction, according to Bloomberg Intelligence senior commodity strategist Mike McGlone. He notes that the last two influential crude declines in 2018 and 2020 were almost tick-for-tick with SPX500. The 20-quarter correlation between the Bloomberg Commodity Spot Index and SPX500 currently sits at 0.90, the highest reading since 1960. The BI analyst says the last time the correlation peaked was back in 2013, followed by the spectacular oil price crash of 2014, which then spread to the rest of the commodities complex.

Thursday, 23 September 2021

Gold Rejected Below 1782 Level Despite Dovish FOMC

GOLD prices closed at $1,767.80, after setting a high of $1,788.25, and a low of $1,765.25. After surging for two consecutive sessions, gold dropped on Wednesday, amid the strength of the US dollar. On Wednesday, the greenback was strong across the board, reaching 93.51, which was its highest level since August 20. The US dollar pushed the price of gold down after the Federal Reserve signaled that it would ease its monthly bond purchases by next year and increase interest rates sooner than expected.

The appeal for the yellow metal was subdued after the US Federal Reserve mentioned in its latest policy meeting on Wednesday that tapering of economic support would begin this year, and interest rates could potentially rise next year, in response to inflation.

As a result, the US Dollar Index reached a one-month high, decreasing the appeal of gold. The precious metal is often used a hedge against higher inflation. However, it tends to lose its value if the Fed increases its interest rates or reduces its support for the economy.

Meanwhile, on Wednesday, Fed Chair Jerome Powell said that the Fed was pushing ahead with its research into implementing its digital currency.

The Fed has also revealed its plans to release a paper on the matter shortly. According to Powell,  no decision has been made regarding this issue as yet, and the Fed is not under any pressure to rush into a decision like this without doing proper research of its own.

Powell also said that the Federal Reserve could wrap up the tapering of its bond purchases by the middle of the next year. The central bank has been buying $120 billion a month in Treasuries and mortgage-backed securities, to support economic recovery from the coronavirus pandemic. These comments helped the US Dollar Index to achieve its highest level in one month and weighed heavily on the precious metal, turning its momentum red for the day. At 19:00 GMT, the existing home sales for August came in, remaining in line with the expectations of 5.87M. It had zero impact on the prices of the US dollar and GOLD.

Gold – XAU/USD – Technical Outlook

Gold has fallen below the pivot point support level of 1,773, towards the next support level of 1,759. Gold prices will be exposed to an additional support mark of 1,750 if they break below the 1,759 level. A bullish crossover at 1,773 would also open the yellow metal to the 1,781 level.

Daily Technical Levels

Support           Resistance

1,759.29           1,782.29

1,750.77            1,796.77

1,736.29            1,805.29

Pivot Point:       1,773.77

GOLD has completed a 61.8 percent Fibonacci retracement at 1,781 on the 4-hour timeframe. The close below this level has triggered a sell-off in the precious metal. The RSI and Stochastic indicators are both in the sell zone, but the 50 SMA at 1,773 provides resistance. As a result, the bearish bias reigns supreme below 1,773 and vice versa.

 www.moneylifeconsulting.com

Wednesday, 22 September 2021

Todays Overview on XAUUSD by Money Life Research

  The market which was active last night saw an increase in the price to reach the level of 1780.00 also testing the small resistance area found last week.


 From the chart shows the market is moving bullish trending on the H1 timeframe and the market reaction now shows a horizontal market movement taking place after yesterday’s rise.


 So through this chart what is the potential that could happen to gold at the moment?  In my opinion, there are 2 probabilities that can happen at this point.  For certain reasons as follows:


 Situation 1: The fixed price continues to rise to a higher level if it manages to break at the price of 1780.00 and there is a retracement at that price.


 Situation 2: The price is moving horizontally and showing a downtrend tendency because the current price has a confluence on the past resistance area as well as the trendline that was tested yesterday.  As well as at the current price there was a candlestick reversal in the last few hours.


 So through these two situations, traders need to look more closely at the lower timeframe to make a trade as well as get the best space and opportunity to trade.


 If looking for an opportunity to buy, the price of 1775.00- 1770.00 will be the nearest support level at this point.


 If looking for an opportunity to sell it is better to wait for the price to make a breakout on the trendline area.


 Register with us to always know the science of trading as well as the latest updates on technical analysis & fundamental analysis at


 www.moneylifeconsulting.com

📕 Comment on Gold on September 22, 2021

Currently, precious metal Gold is facing a strong resistance zone around 1780 and in my opinion, it is likely that Gold will have a slight correction here and we can establish a sell position.  down at this price zone with the target around 1755-1760.


During Asian trading hours, the market trades lightly, investors are waiting for the Fed meeting, and the market has digested all the information and sentiment.  Therefore, the market is currently maintaining a neutral status.  Before the meeting, the market trend may not be large and clear.

Tonight, the Fed will hold an important meeting on interest rates, in which the "dot plot" will be announced.  Before the meeting, the market may not be too volatile.

 Reference strategy: Get free trading signals Now https://bit.ly/3xYiZ24


Remarketing tags may not be associated with personally identifiable information or placed on pages related to sensitive categories. See more information and instructions on how to setup the tag on: http://google.com/ads/remarketingsetup --------------------------------------------------->